How To Create A Leaderboard In Google Sheets
Creating a Leaderboard with Google Data Studio
At work, we have been mulling over ways to improve and reward productivity as well as create an enabling environment for competition in our Content Marketing team. This led to us coming up with ways to gamify the entire process. We decided to build a weekly leaderboard that automatically updates itself and ranks each individual on the team.
I wanted to do this on Google Data Studio , so I scoured the internet to find resources that can help me build a leaderboard on Data Studio, hence why I decided to create mine, in case anyone wants to do something similar.
Steps I followed
- Get the data in google sheets.
- Perform a sum if to see how many articles is being published by each writer
- Write a formula that automatically sorts the leaderboard .
- Connecting the data to google data studio.
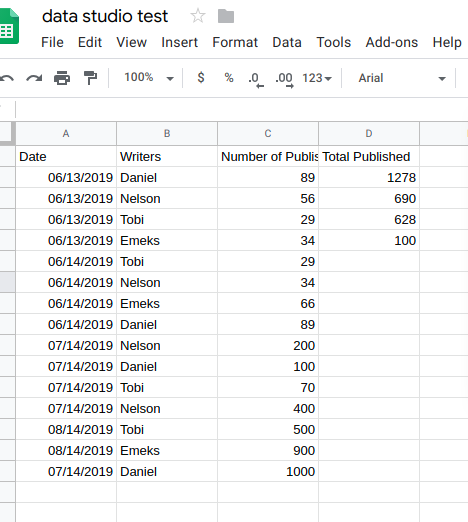
Let's start from the top. Before you can perform any tasks on google sheets you need to first have the dataset in the sheet you are working on

This is a dummy dataset with 4 columns, Date, Writers, Number of Published articles(daily), Total Published. The Total Published column is a formula that automatically adjusts when a new dataset is added. The formula is =sumif(B2:B,$B2,C2:C) where B2:B is the range with the names of the writers, $B2 is the criterion which in this case is it should check if it sees the name of the writer in any row, and C2:C is the column that should be summed.
Once we have that sorted, next thing we will want to do is to sort the list so that when we are importing in Google data studio , it automatically just ranks based on the arrangement on the spreadsheet. There are two ways to go about it;
- We can manually sort using the in built sort function. To do this, click on Data, then select Sort sheet by column D( Total published) Z-A. This will then sort the entire sheet in descending order. However, the issue with this is that it requires manual intervention, so whenever new information is inputted you will need to perform the process again.
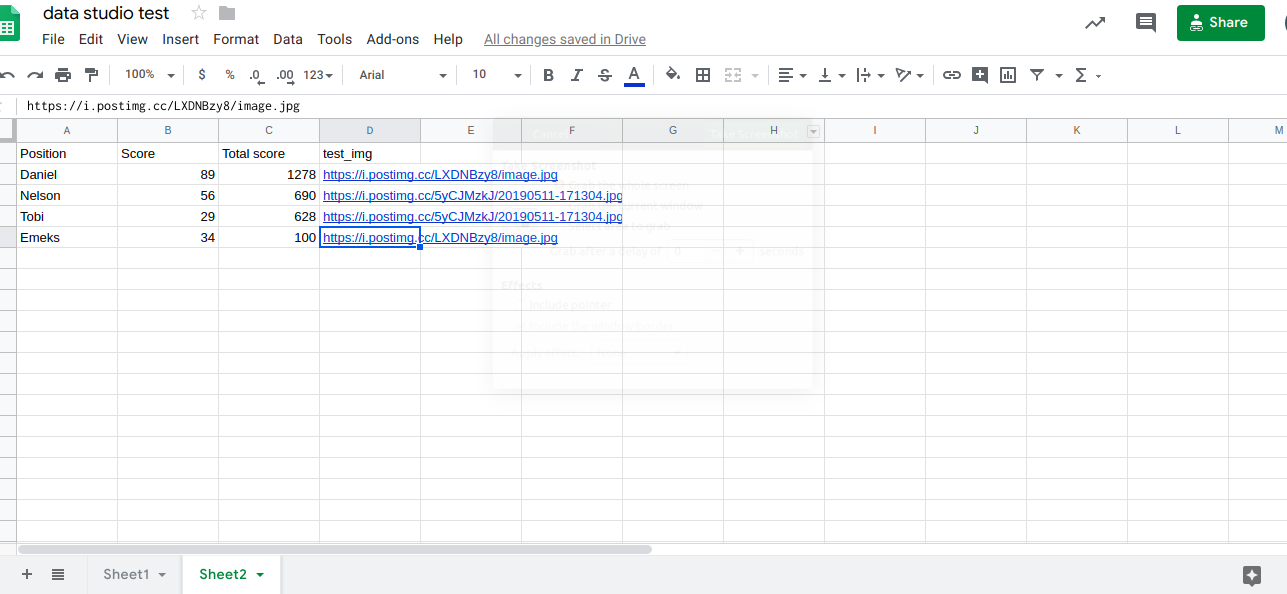
- We can write a formula that automatically sorts the data in descending order and whenever new information is added, it can automatically resort itself depending on if there was an increase or a decrease. To do this we simply created a new tab,

There are four columns; Position, Score, Total Score and test_img. Where position is the name of the writers by rank, score in the number of daily published articles, and total score(the one that determines the rank) is the Total Published article. I added the test_img to add the pictures of the writers so as to add spice up the leaderboard. To create an image url you can use postimages.org. To have the data you want in this new sheet, simply do this formula, =QUERY(Sheet1!B2:D5, "SELECT * ORDER BY D DESC"). What this formula does is to Query sheet 1 from range B2:D5 (D is the column that has the total published articles. Ensure you specify the row in column D with data in them),Select * selects every information, if you do not want every information then you can specify the columns you need. Order By D is what ranks the sheet according the number of total published articles. By default, Order By ranks by ascending order so to change this we will have to specify that we want the data in we will have to use the keyword DESC.
Congratulations! We now have our leaderboard on google sheets. It's now time to connect it to google data studio to get that lovely interface .
Visit datastudio.google.com to get started. On the left hand navigation bar, select Reports. You'll see a blue icon at the bottom right

Clicking on the icon creates a blank page. At the bottom right corner, select " Create New Data Source" . This then brings a list of data sources that you can connect to data studio, but for the purpose of this tutorial we will be using Google sheets, find it and select it. Once that's done, it will show you sheets you have associated with. You can reduce the noise by selecting "Owned by Me" this will then show you sheets that you created. Select the sheet you created.

Once you are done click on Connect. This will then present this interface. For this leaderboard, the 'score' isn't relevant to us, so click on the three horizontal dots and click on Disable.

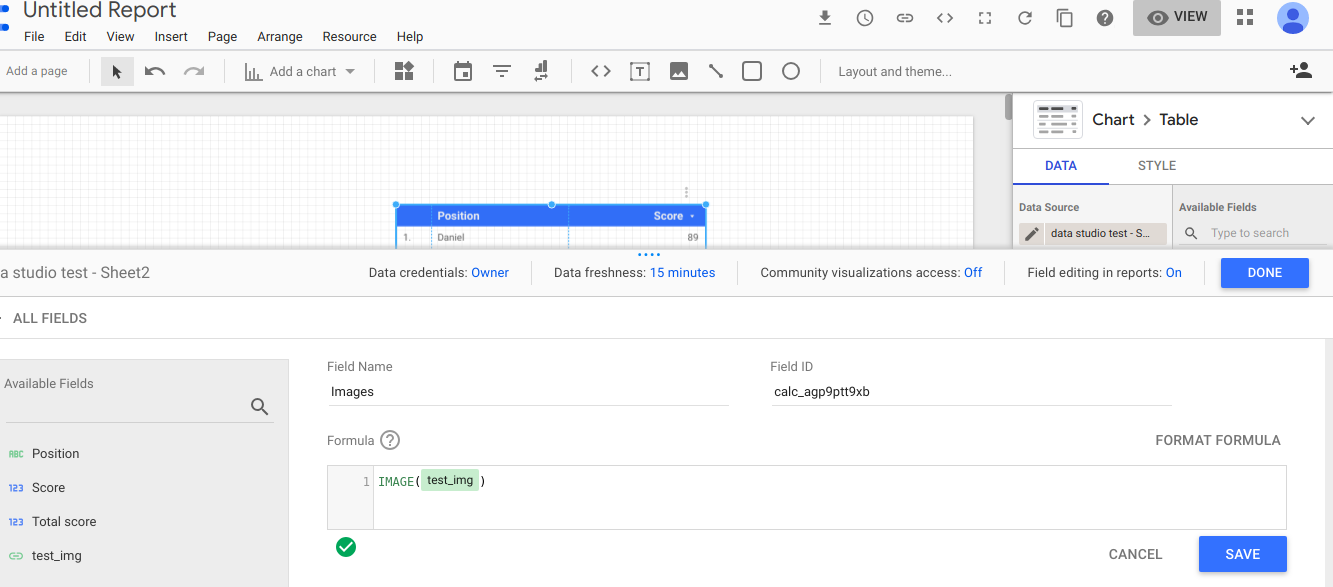
Once you have done all that, click on Add to report at the top right corner. This then opens up a blank page. Select on "Add a chart" and select a table. To have our images to display in Data Studio, we will create a new calculated field. To do this click on "Create New Field"

Once you are done setting up, click on Done. Select Images and Position as dimensions, since we have score disabled, Total score becomes the default metric.
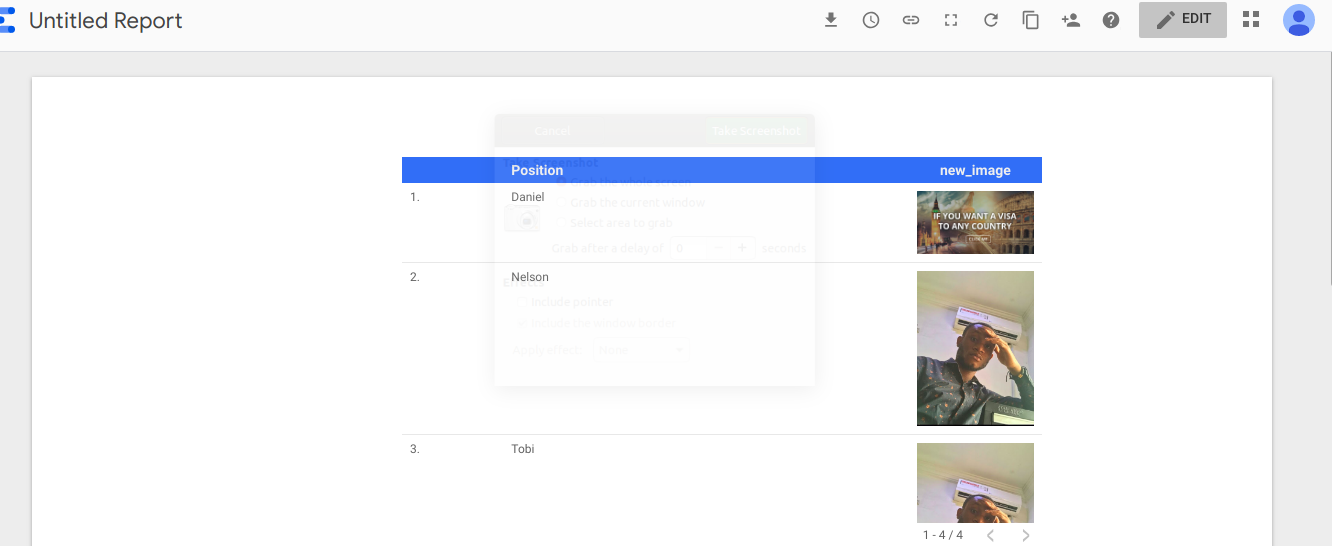
This is how the final leaderboard should look like.

Th best part of google data studio is that when you adjust anything on your google sheet, it will automatically update on data studio. You just have to click on the refresh icon.
Thanks for reading, if you have any questions, please let me know in the comments.
Leave a clap if you enjoyed reading this.
How To Create A Leaderboard In Google Sheets
Source: https://medium.com/@nnamdi.okafor/creating-a-leaderboard-with-google-data-studio-c36b8b5cdb1
Posted by: littletonhiming62.blogspot.com

0 Response to "How To Create A Leaderboard In Google Sheets"
Post a Comment